Attention Index: The Silence is Deafening

Online Marketing has been around for decades, and we are still arguing about the same things. Why are Facebook and Google Analytics reporting different numbers? Why has no one bought a single item despite my Insta ad getting 10,000 views?
This view is based on the assumption that visibility equals impact. Reach, impressions, and likes became the dominant metrics for measuring content performance. Platforms encouraged them, dashboards reported them, and marketing teams optimized for them.
But none of these metrics actually measure what matters most:
Human attention.
If you think pushing out more AI slob is the answer to this, boy, do we have bad news for you.
Fake news, agitation spirals, AI-generated videos all distort the visibility measures, reach has become an increasingly weak signal of real human engagement.
What matters is not how many people see your content.
What matters is what people do after they see it.
This is the core idea behind the Attention Index.
The Problem With Traditional Social Metrics
Most marketing dashboards still revolve around three categories of signals:
- Reach / impressions
- Engagement (likes, comments, shares)
- Follower growth
These metrics are easy to track, easy to visualize, and the inflated numbers look so sweet in a PowerPoint. But they tell us very little about intent.
A like is the lowest-effort interaction possible.
An impression might last less than a second.
Neither indicates that a user actually considered your product, evaluated a solution, or intent to purchase. Or trusted your brand.
When you stop and think about it for a second, you see the pitfall we all fell into and still do. Just because someone saw your ad, perhaps even clicked on it, you cannot imply anything from it. We thought for way too long a like or click meant, they love us. They trust us. They want us. What a BS.
Intent Signals not Engagement Fluff
The Attention Index takes a different approach. Instead of treating all interactions equally, it measures signals that indicate cognitive engagement and intent.
Different actions codify different meanings.
Saves show high intent and future reference. Perhaps your ad is involuntarily funny, and they want to meme it. Perhaps your product hit a sweet spot, and they plan to take the laptop out and buy it later.
Profile visits after seeing your content show involvement.
Especially if the Watch Time is high. Who the hell put that in my feed, and can I trust them?
Comments that include questions show that their brains are processing your information and thinking it through.
Not all interactions are equal
A user who saves a post about a product is far closer to making a purchase decision than someone who casually likes it.
The Attention Index assigns intent weights to these signals and aggregates them into a single score.
Conceptually, it works like this:
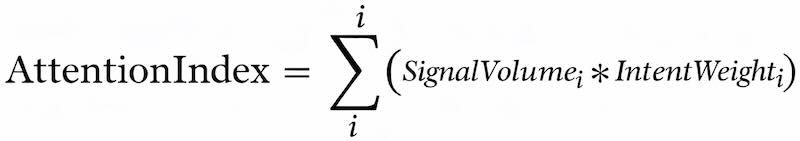
Instead of measuring surface engagement, the index captures how strongly content pulls users toward action.
Measuring Attention Across Platforms
Each platform plays a different role in the attention economy.
Short-form video platforms tend to generate discovery and trend exposure, while visual search platforms often capture consideration and planning intent.
This becomes visible when signals are weighted by intent.
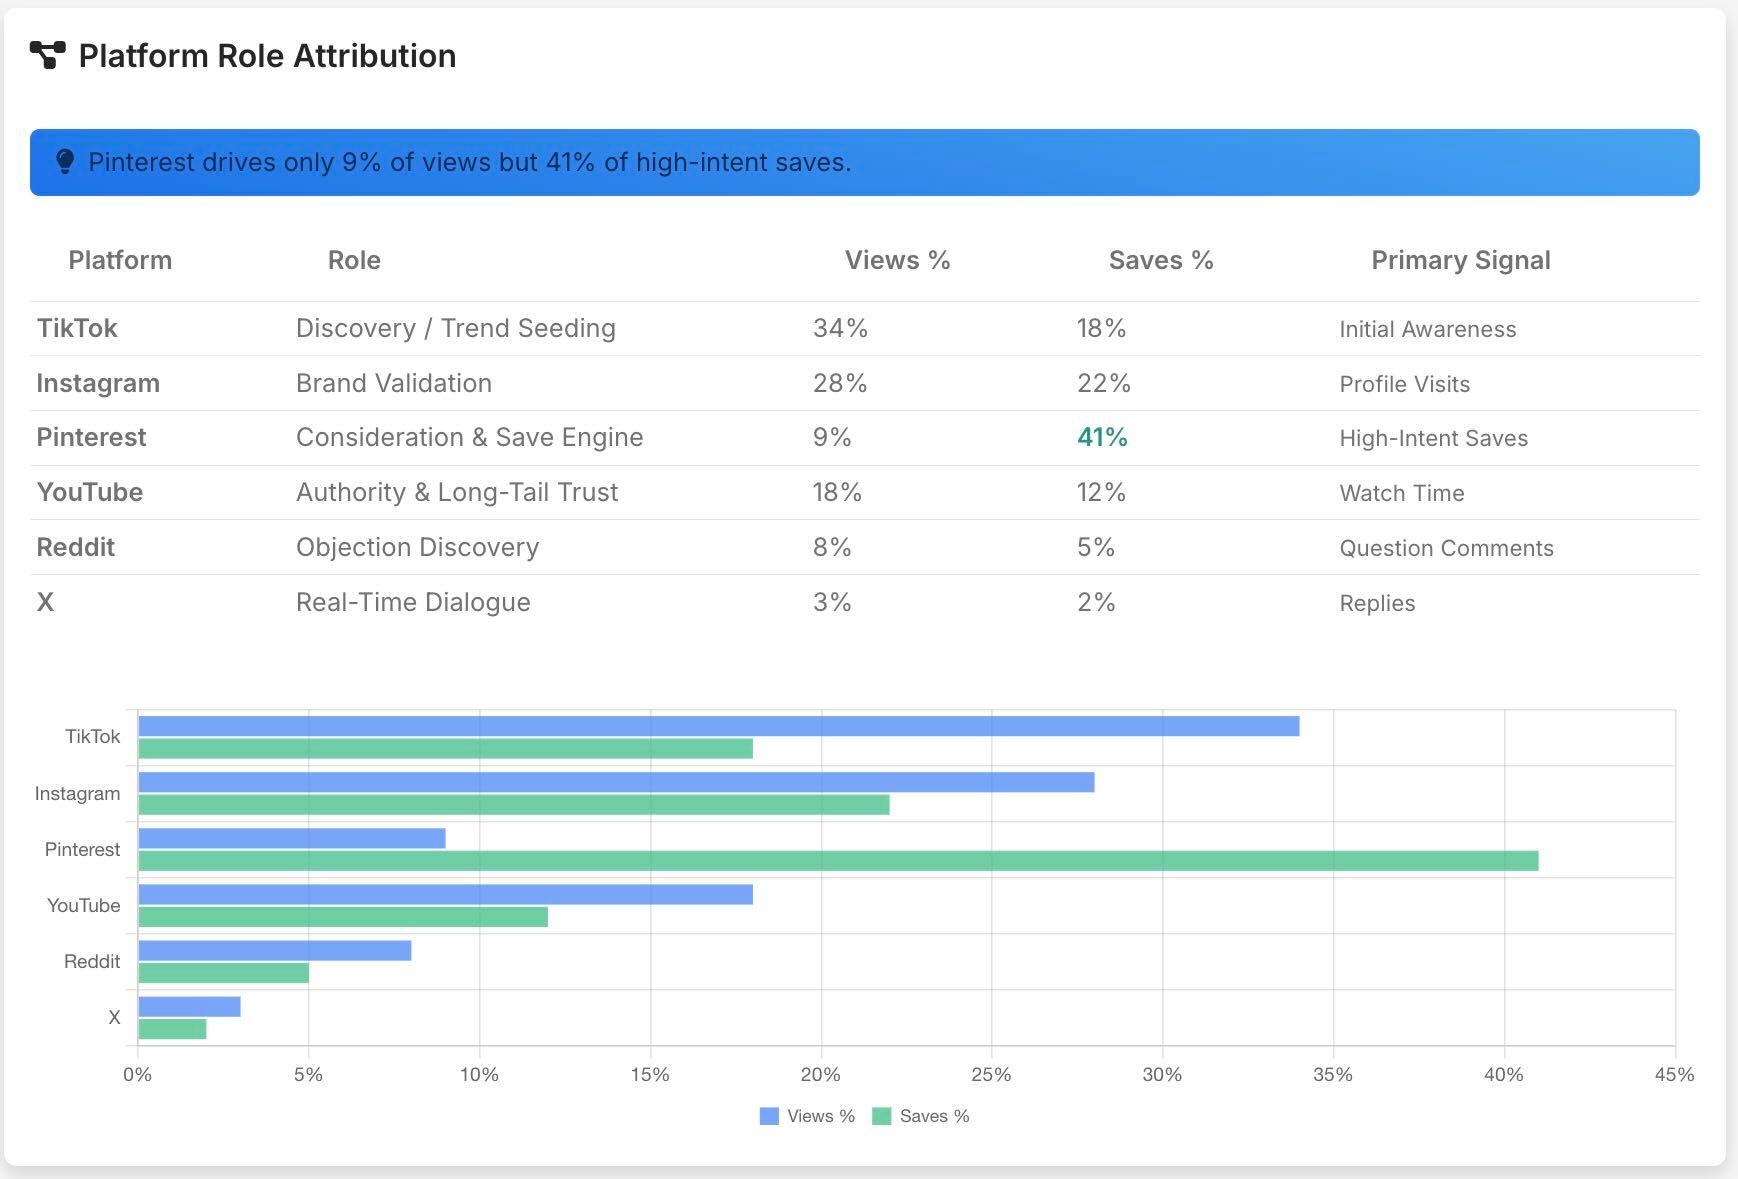
For example, a brand might observe the following pattern:
- TikTok for Discovery measuring Awareness
- Instagram for Brand validation, measuring Profile visits
- Pinterest for Consideration measuring Saves
- YouTube for Authority measuring Watch Time
- Reddit for Objection discovery measuring Questions
- X for Real-time dialogue measuring Replies
In this framework, the goal is not to maximize views everywhere. That looks good in PowerPoint, but does not move the needle for the business.
The goal is understanding where attention is deepening and why.
Detecting Audience Intent Shifts
One of the most powerful aspects of attention-based analytics is its ability to reveal when audience behavior changes.
Traditional analytics rarely capture this. If you lose ten likes on Instagram and gain ten likes on X, what does it tell you? Nada, Niente, Nichts, nothing.
With the Attention Index, we regularly see deeper patterns.
An audience moving from inspiration to evaluation often shows subtle behavioral signals across different platforms:
- Saves increase
- Profile visits rise
- Question comments appear
- Passive likes decline
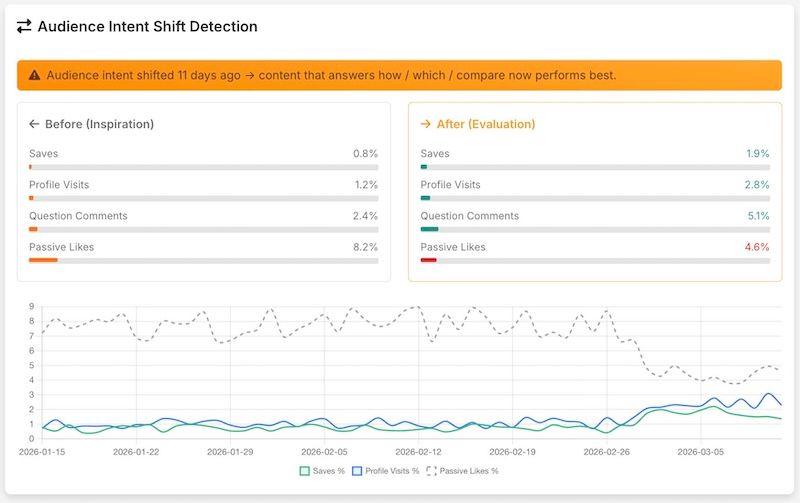
The above pattern indicates a shift from browsing to decision-making, and this should ring all the bells to change your content strategy. You do not need any more of the lofty inspirational-quote-on-a-picture content. Instead, feed your audiences with comparisons, tutorials, questions, and explanations.
In other words, follow your audience and move from discovery to evaluation, and align your content with the customer journey.
Not all Social Platforms are equal
Another misconception in marketing analytics is that all platforms should be judged using the same metrics.
Spoiler: They should not.
Different networks capture different parts of the customer journey.
Again example-time:
- TikTok drives 34% of views but only 18% of high-intent actions
- Pinterest drives 9% of views but 41% of saves
If we optimized purely for reach, TikTok would appear to be the best channel.
But from an attention perspective, Pinterest plays a much more valuable role.
This insight changes how budgets and content strategies should be allocated.
The Comment-to-Content Feedback Loop
Attention signals do more than measure performance. They also reveal what the audience wants answered next.
When users repeatedly ask the same question in comments, they are telling you something very valuable: there is unresolved intent, and your copy sucks.
Typical patterns include questions such as:
- "@s this safe for children/dogs/cats/hippopotamus?"
- "How often should I use this? Currently, I use it every two minutes, seems excessive."
- "Why is this more expensive than drugstore brands?"
Each of these questions represents a barrier to purchase, and users are telling you this. You just need to listen.
Instead of treating comments as community management tasks, they can be used to generate high-intent content opportunities.
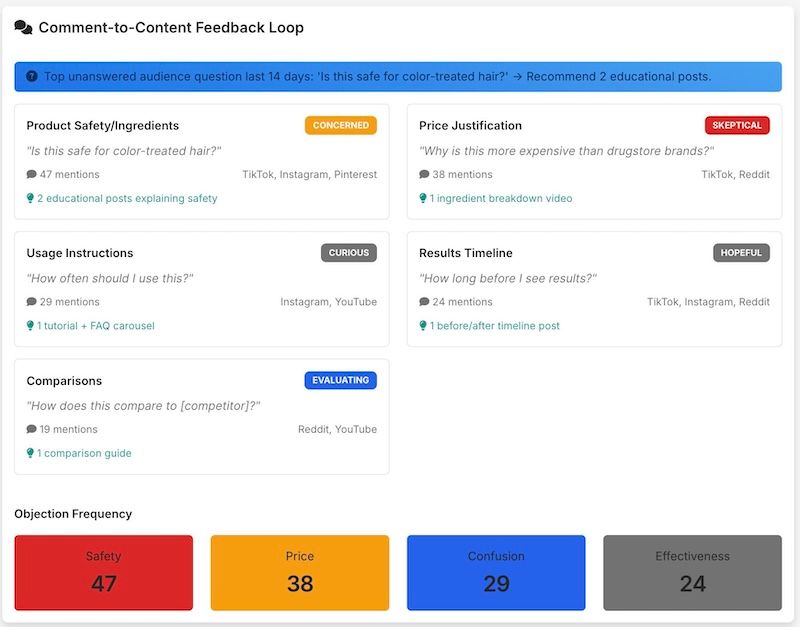
This creates a feedback loop:
Audience questions → Content creation → Higher intent signals → Improved Attention Index
Actionable Analytics, not PowerPoint
If you read this far and still don't know what graph to put in your monthly reporting, you missed the point entirely.
Even if the Attention Index gives you a numerical value as a health indicator, it's not about playing that numbers game.
The true benefit of the Attention Index is the revealing nature of audience behavior. It helps your team gain actionable insights, not jacking up numbers in a presentation no one will ever look at again.
Instead of optimizing for vanity metrics, your team begins optimizing for momentum toward purchase.
It is about how many people care enough to act.
If you are interested in the tool shown in the images in this article, they are taken from our Marketing Analytics hub. Once you connect your social network accounts, you can create the Attention Index and other reports with a single click.
